Fixed vs. Variable Expenses and Breakeven Analysis: When Does Your Construction Business Start Making a Profit

As a business coach and advisor, one of the most impactful conversations I have with customers revolves around understanding what it takes to make a profit by analyzing their cost structure—specifically, distinguishing between fixed and variable expenses—and how that affects their breakeven point. Whether you’re running a construction company, a retail shop, or a bustling restaurant, mastering this concept can be the difference between survival and sustainable success.
Let’s break this down with clarity and real-world examples.
What Are Fixed and Variable Expenses?
- Fixed Expenses are costs that remain constant regardless of your business activity level. They do not change with sales or production volume.
- Variable Expenses fluctuate in direct proportion to your revenue or output. More sales revenue or projects means more variable costs.
Understanding the balance between the two helps you:
- Plan more accurately
- Price your services and/or products effectively
- Make better hiring and investment decisions
- Know exactly what it takes to break even—that is, to cover your expenses without incurring a loss.
Construction Industry
Variable Expenses:
- Job materials (e.g., concrete, lumber, flooring)
- Subcontractor fees (e.g., electricians, plumbers)
- Equipment rental (e.g., excavators, lifts, scaffolding)
- Direct labor on job sites (typically paid hourly)
- Direct labor burden (payroll taxes, workers compensation, benefits)
- Fuel and transportation related to specific projects
Fixed Expenses:
- Office rent or warehouse lease
- Business insurance premiums
- Salaried administrative staff
- Utility bills for a permanent office location
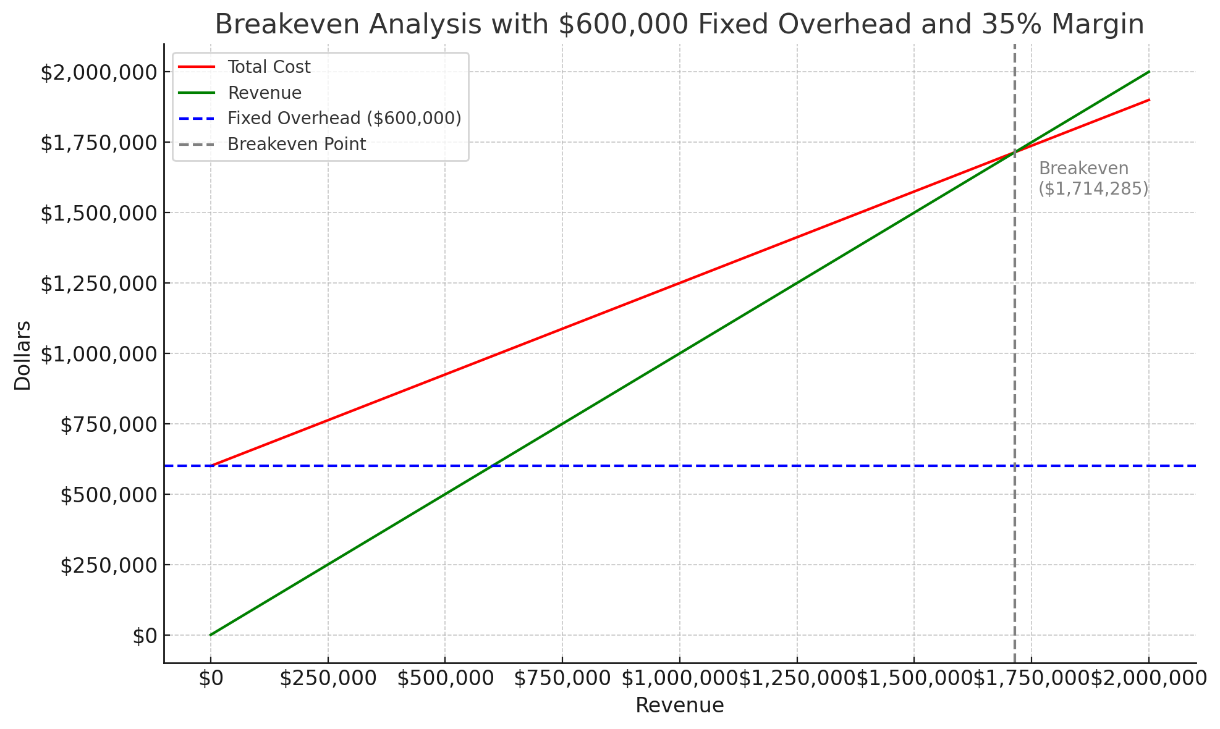
Breakeven Example: Let’s say your annual fixed costs are $600,000 and that you markup your variable costs to arrive at an average 35% contribution margin, that’s how much your projects contribute to covering the overhead.
Breakeven Revenue Formula
The breakeven point in terms of revenue is calculated as follows:
Breakeven Revenue = Fixed Costs / Contribution Margin
$600,000 / .35 = $1,714,285.71
You will need to generate $1,714,286 in revenue to break even and anything beyond that is profit.
Here’s the breakeven analysis in graph format:
- The blue dashed line shows your fixed overhead.
- The red line is your total cost (fixed + variable).
- The green line is your revenue.
- The gray dashed line marks the breakeven point, which is $1,714,286 in revenue.
This chart helps visualize exactly how much you need to bring in before turning a profit.
Why This Matters
When you clearly define your fixed and variable expenses, you’re better positioned to:
- Adjust pricing intelligently
- Manage payroll strategically during slow seasons
- Negotiate vendor contracts
- Scale your business with intention
Breakeven analysis isn’t just a math exercise—it’s a decision-making compass. When you know your breakeven point, you know exactly what you need to sell, build, or serve just to stay afloat—and how much more to hit your profit targets.
Final Thought
Every dollar you bring in above your breakeven point contributes directly to your profit—but only if you manage your variable costs wisely. Understanding this relationship helps you shift from reactive to strategic business operations.
If you’re unsure how to calculate your breakeven point or how your cost structure stacks up, let’s talk. We help construction, retail, and restaurant owners like you take control of their numbers so they can focus on growth with confidence.
Stay tuned for our next issue of Fun With Finance where we break this down for the retail and restaurant industries.
